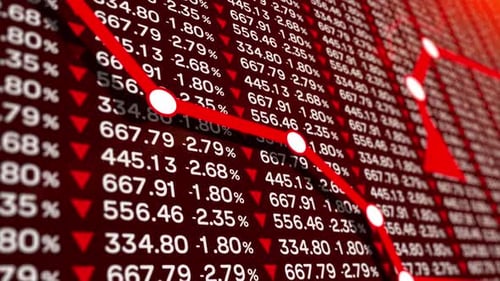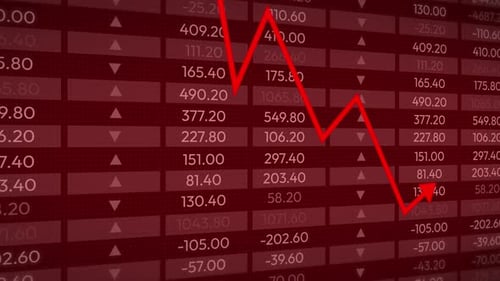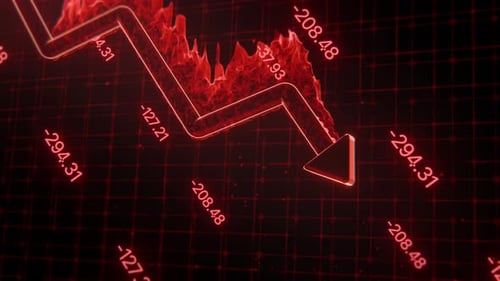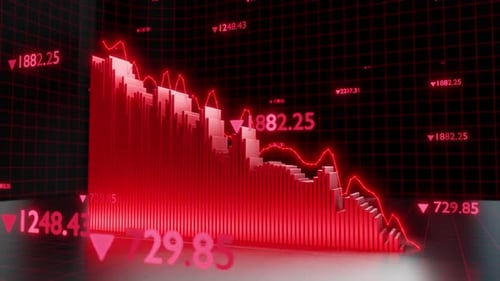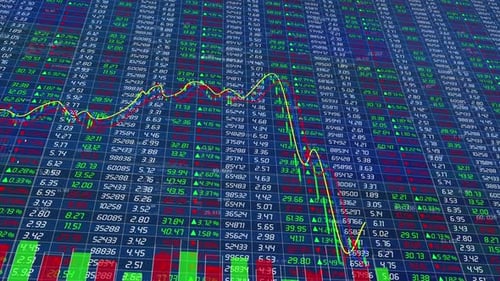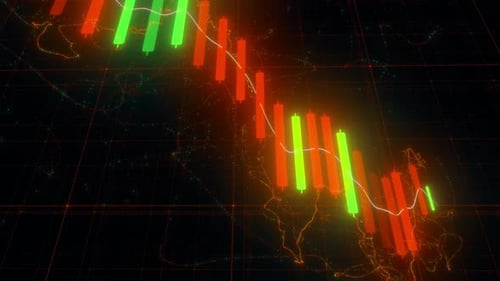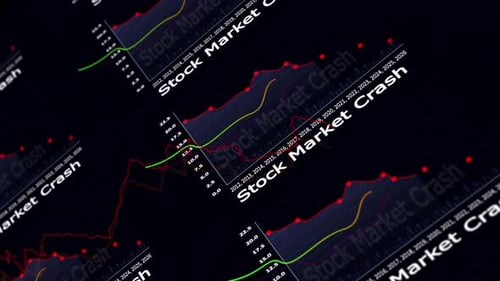
Stock Market, Stock Market Down, Stock Market crash, Stock Market Limit Down, The red line
By connectmizan25One great value subscription from €14.50/month
- Unlimited downloads of 27+ million creative assets
- AI Tools: video, image and more
- Lifetime commercial license
- Easy cancellation
Attributes
- Length
- 0:10
- Resolution
- 3840 x 2160
- File Size
- 19.6 MB
- Frame Rate
- 29.97 fps
- Alpha Channel
- No
- Looped
- No
- Video Encoding
- H.264
- Orientation
- Horizontal
- Commercial License
- Further Information
Description
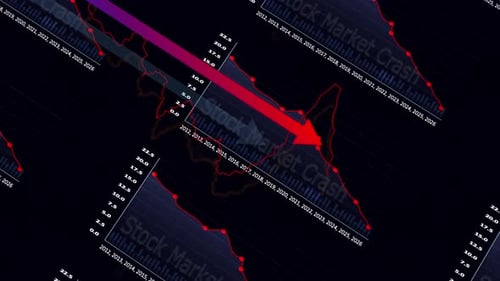
This animated clip presents a dynamic visual of a financial data graph, charting market fluctuations and specifically highlighting a 'Stock Market Crash' scenario. The geometric design features clear axes, data points, and trending lines, with information appearing to evolve over time. Rendered on a dark background, the digital display uses contrasting colors like red for downturns and green for positive trends, creating an urgent and analytical tone. This visual effect is ideal for enhancing financial news segments, economic reports, business presentations, or any content requiring a compelling depiction of market volatility and potential crisis. The demonstration shows multiple instances of this graph, suggesting its use for complex data visualizations.