One great value subscription from €14.50/month
- Unlimited downloads of 27+ million creative assets
- AI Tools: video, image and more
- Lifetime commercial license
- Easy cancellation
Attributes
- File Types
- BLEND, MTL, GLB, OBJ
- File Size
- 6.47 MB
- Textures Included
- No
- Rigged
- No
- Animated
- No
- Polycount
- 27.8K polygons
- Commercial License
- Further Information
- Part of Pack
- Chart Diagrams V2 3D Icon Pack
(10 items)
Description
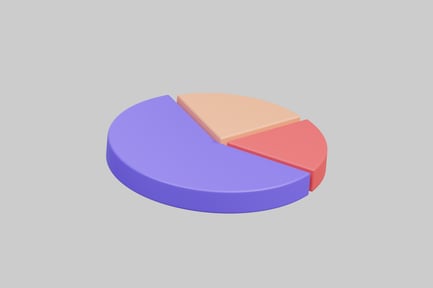
The pie chart consists of three segments yellow, orange, and red. The yellow segment occupies the leftmost position. The orange and red segments overlap, with the orange segment partially obscured by the red, creating a layered effect. This overlapping gives the chart a three-dimensional appearance.