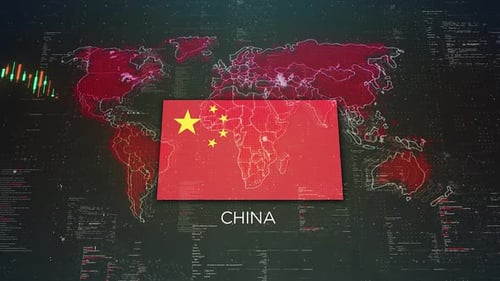
Futuristic China Map with Digital Stock Market Data
By Motion_VisionOne great value subscription from €14.50/month
- Unlimited downloads of 27+ million creative assets
- AI Tools: video, image and more
- Lifetime commercial license
- Easy cancellation
Attributes
- Length
- 0:20
- Resolution
- 1920 x 1080
- File Size
- 353 MB
- Frame Rate
- 29.97 fps
- Alpha Channel
- No
- Looped
- No
- Video Encoding
- ProRes
- Orientation
- Horizontal
- Commercial License
- Further Information
Description
An animated visual effect showcases a glowing, wireframe-style map of China, dynamically displaying real-time stock market data. The map is overlaid with a grid of updating numbers, percentages, and values, illustrating economic trends with red for losses and green for gains. The background features a dark, space-like environment with subtle connecting lines and glowing particles, enhancing the high-tech and analytical feel. This graphic is ideal for financial news segments, corporate presentations, economic reports, or any content requiring a modern, digital representation of China's market performance and global economic influence.