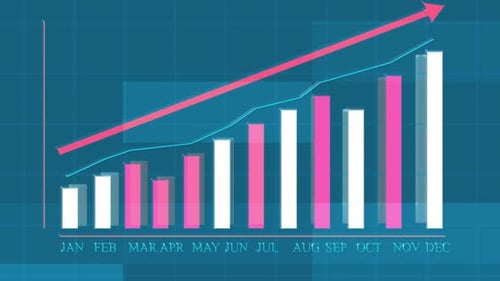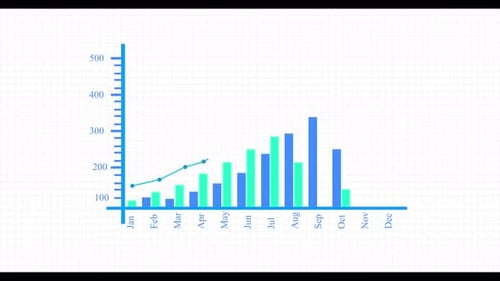
Animated Bar and Line Chart for Business Data Visualization
By Think_About_LifeOne great value subscription from €14.50/month
- Unlimited downloads of 27+ million creative assets
- AI Tools: video, image and more
- Lifetime commercial license
- Easy cancellation
Attributes
- Length
- 0:06
- Resolution
- 3840 x 2160
- File Size
- 1.59 MB
- Frame Rate
- 29.97 fps
- Alpha Channel
- No
- Looped
- No
- Video Encoding
- H.264
- Orientation
- Horizontal
- Commercial License
- Further Information
Description
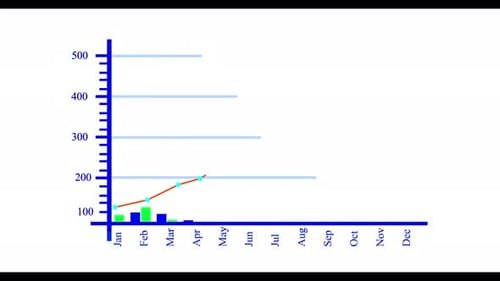
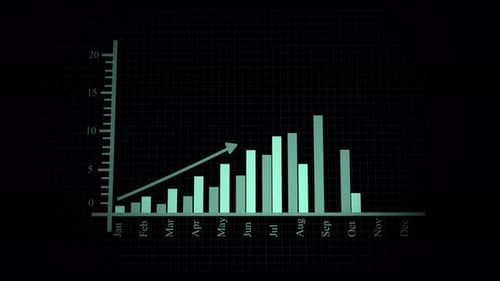
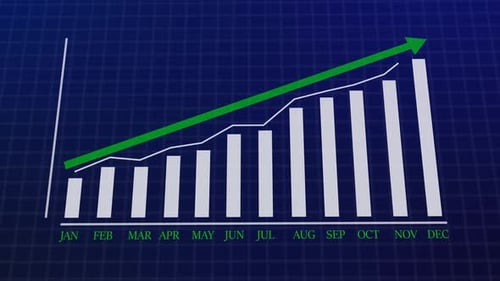
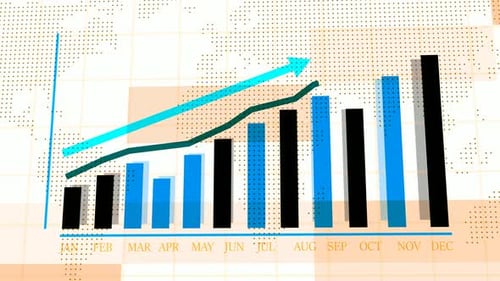
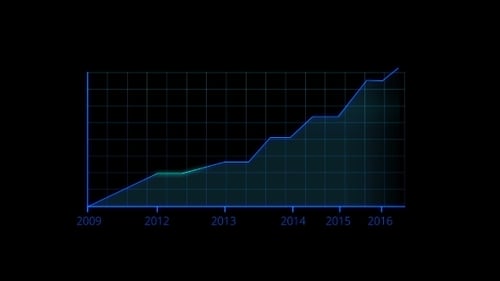
This animated data visualization features a dynamic bar chart and line graph tracking monthly progress. Vibrant blue and green bars grow steadily, representing increasing values, while a corresponding line graph plots a rising trend over 12 months, from January to December. Presented against a subtle grid background, the clean, minimalist design offers a clear and professional way to illustrate statistical information and performance metrics. This versatile asset is ideal for corporate presentations, financial reports, business analytics, or any project requiring a modern and precise depiction of data evolution and growth over time. Its sleek animation style enhances the clarity and impact of complex numerical insights.