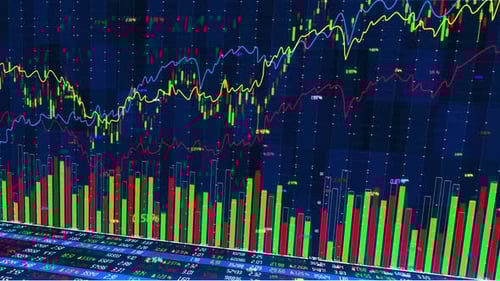
Background of Stock Chart And Bar Graph
By XtremelevelOne great value subscription from €14.50/month
- Unlimited downloads of 27+ million creative assets
- AI Tools: video, image and more
- Lifetime commercial license
- Easy cancellation
Attributes
- Length
- 0:10
- Resolution
- 1920 x 1080
- File Size
- 62.2 MB
- Frame Rate
- 25 fps
- Alpha Channel
- No
- Looped
- No
- Video Encoding
- H.264
- Orientation
- Horizontal
- Commercial License
- Further Information
Description
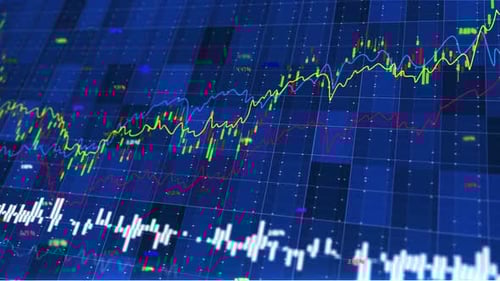
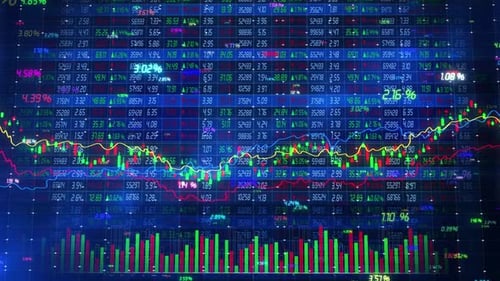
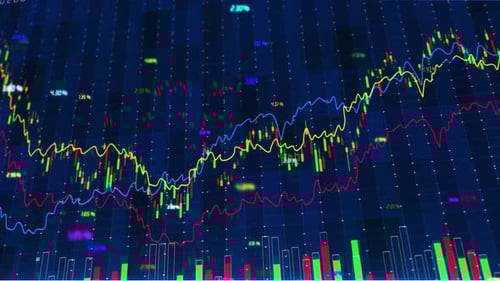
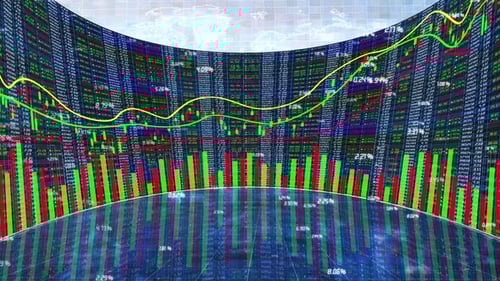
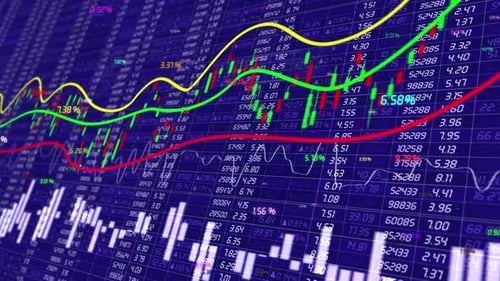
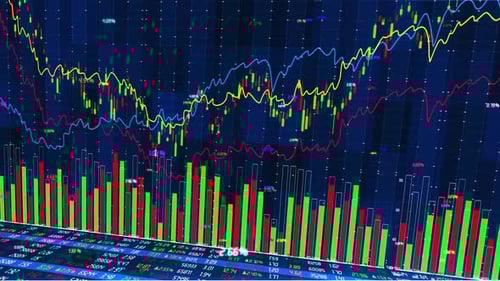
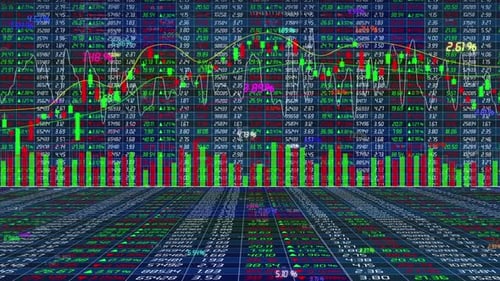
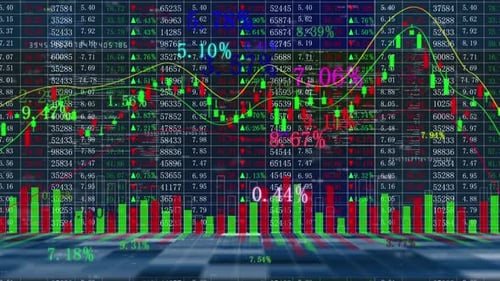
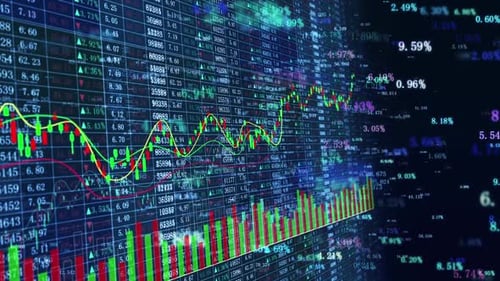
This animated visual features a complex, dynamic 3D financial data display. Scrolling numerical values and percentages populate the bottom, while a grid background sets the stage for multiple animated line graphs in blue, yellow, and red. Interspersed are candlestick charts and active bar graphs, represented in vibrant green and red, indicating market fluctuations. The perspective subtly shifts, offering a comprehensive view of the evolving digital interface. This graphic is ideal for enhancing presentations, corporate videos, or any content focused on stock market analysis, financial reporting, and economic trends, conveying a sense of real-time data and technological sophistication.