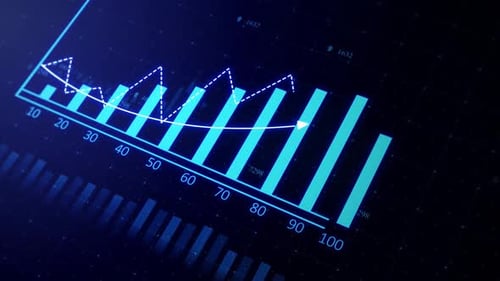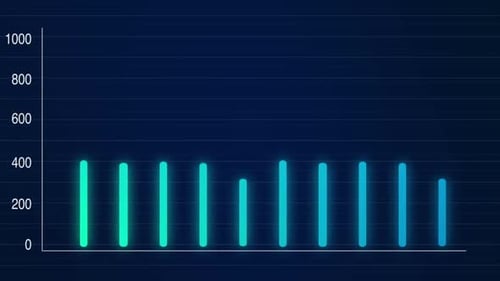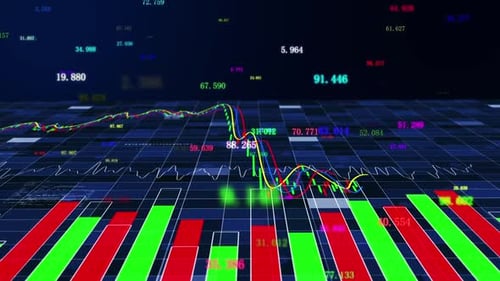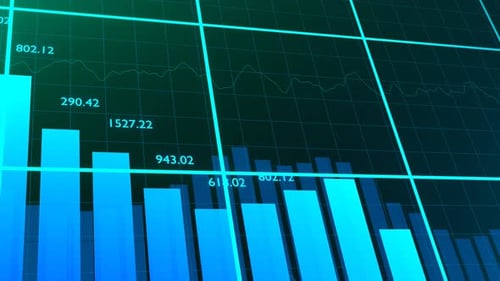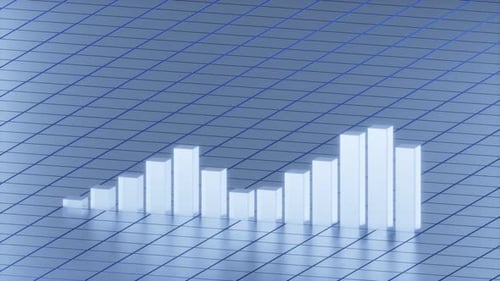
Abstract blue tech background. Financial Growth Bars and corporate statistics, stock market.
By notjungcgOne great value subscription from €14.50/month
- Unlimited downloads of 27+ million creative assets
- AI Tools: video, image and more
- Lifetime commercial license
- Easy cancellation
Already have an account? Sign in
Attributes
- Length
- 0:15
- Resolution
- 3840 x 2160
- File Size
- 145 MB
- Frame Rate
- 60 fps
- Alpha Channel
- No
- Looped
- No
- Video Encoding
- H.264
- Orientation
- Horizontal
- Commercial License
- Further Information
Description
This animated clip features a dynamic bar graph with teal columns rising and falling against a deep blue background. The geometric bars create a clean and modern aesthetic, seamlessly illustrating data fluctuations. With a continuous, looping motion, this visual effect provides an unbroken representation of changing statistics. Ideal for corporate presentations, financial reports, scientific data visualization, or technology explainer videos, it offers a professional and engaging way to present numerical information. The subtle reflections on the surface add depth, enhancing the digital, high-tech feel.