3D Table and Bar Graph of Cryptocurrency Stock Exchange Market Indices
By Infi_StudioOne great value subscription from €14.50/month
- Unlimited downloads of 27+ million creative assets
- AI Tools: video, image and more
- Lifetime commercial license
- Easy cancellation
Attributes
- Length
- 0:09
- Resolution
- 1920 x 1080
- File Size
- 26.8 MB
- Frame Rate
- 24 fps
- Alpha Channel
- No
- Looped
- No
- Video Encoding
- H.264
- Orientation
- Horizontal
- Commercial License
- Further Information
Description
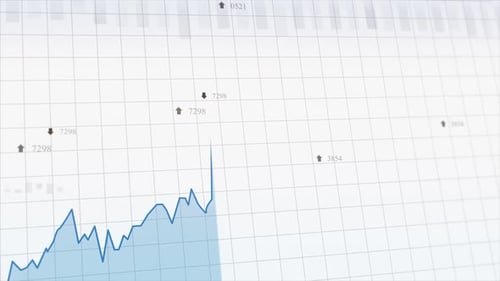
This animated clip visualizes dynamic financial data, showcasing a fluctuating line graph moving across a clean, gridded background. Numeric values with subtle up and down arrows appear and recede, marking significant data points and trends. The area beneath the active line fills with a soft blue hue, providing a clear visual representation of change over time. This modern and professional animation is ideal for corporate presentations, economic reports, business analyses, and any project requiring a sophisticated display of statistics, market performance, or growth metrics. It effectively communicates complex data with clarity and a contemporary aesthetic.